
Here at NOVOS, we know that making data-driven decisions can make the difference between a loss and a victory royale.
As a part of our mission to improve your gaming skills, we are going to share some interesting Fortnite statistics that you can use to make better in-game decisions. These in-depth charts and information were collected from thousands of matches played by NOVOS users. All the games were Public matches and played on PC.
This data can be interpreted in many different ways. We will leave the commentary for you guys.
1. Landing Location by Game Mode.
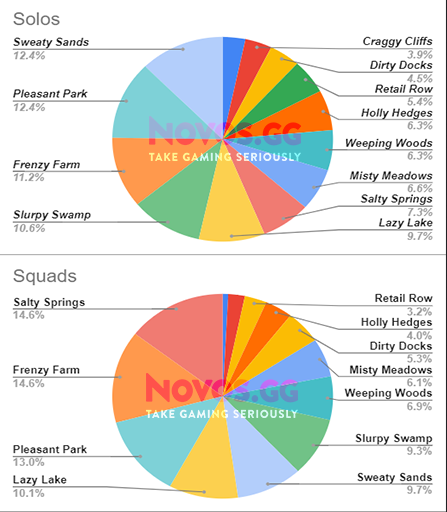
Above, you can see the distribution of all the named landing spots based on game mode (Duos coming soon).
2. Average Rank and Time Survived by Landing Location.
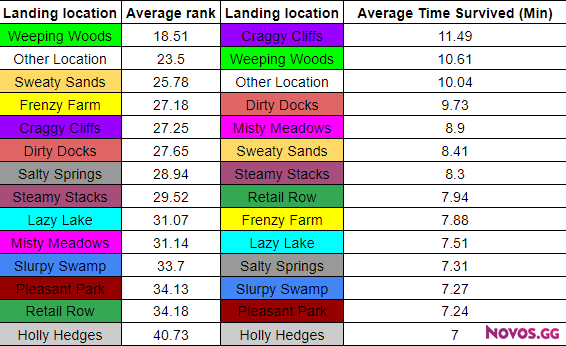
Based on every named landing location (All other spots are grouped in “Other location”), we calculated the average time players survived in a match + the average finishing place (rank).
That is it for now! Tell us what you concluded from this information and what more data you would like to see!
To get your own Fortnite Deep Analytics, go to NOVOS.gg
5 comments
How is possible for the rankings for average placement and average time survived to be different? Isn’t average time survived the direct cause of placement?
Also I would like to see #2 done for only solos, along with other locations having more divisions. For example, include the 3 most dropped “other locations” as their own dataset in the graph.
Finally, I would like to see a champion’s league only dataset
1. Great point. As you can see, the differences are very subtle overall (and especially at the bottom end of the table). Many reasons can cause these differences.
-The overall length of the matches can be a huge factor. Some matches can go the distance, or a large number of players find themselves in the end game, which results in the same survival time overall but with very different placement.
-Maybe the most significant cause of these differences is that there is no division for modes. This means that squads are also part of the statistics.
Players that die early in the game can still have a high finishing place if the rest of the squad is doing well.
-We are currently working on improving our algorithms so we can have the most accurate analysis for players.
2. That is a great idea. It’s in our plans to break the “Other Location” part to all the other unnamed locations Fortnite has to offer.
3. We will also break it down for all the different game modes and champion’s league statistics. Stay tuned 🙂
If you have any more ideas and insights, please feel free to share! We would love to hear what you think.
Very good info. Lucky me I found your blog by
chance (stumbleupon). I have book marked it for later!
Thank you for your blog post.Really thank you! Awesome.
Thanks! And thanks for sharing your great posts every week!